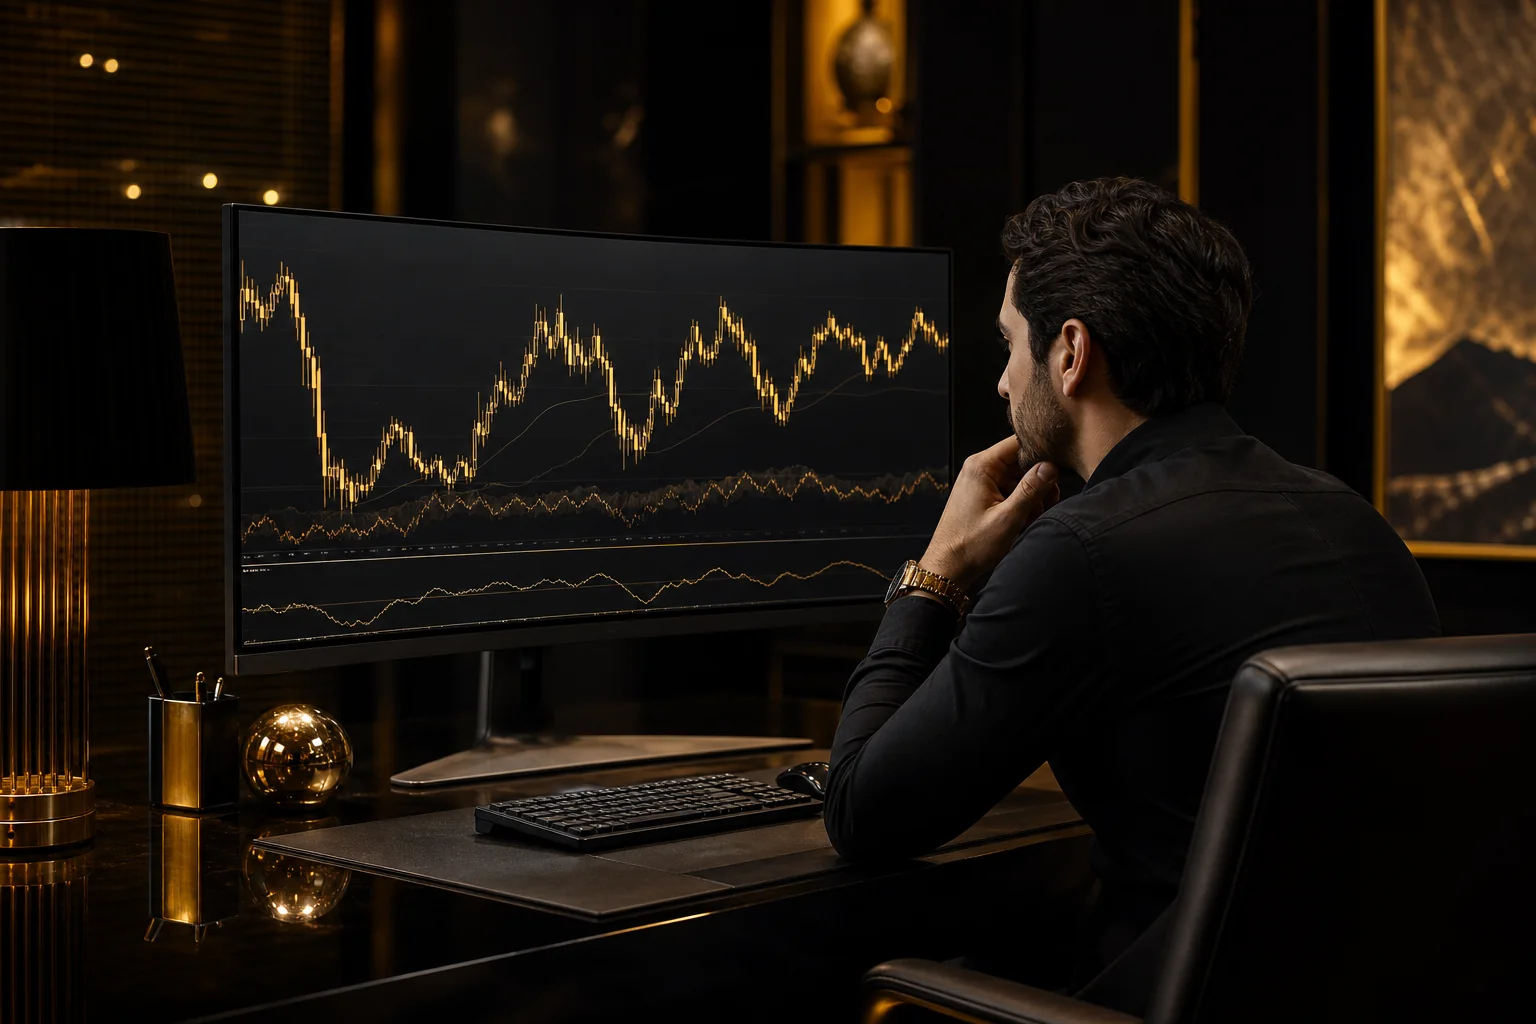
Over 2 million Iranians participate in forex and cryptocurrency trading, with the majority relying on technical analysis tools to make their decisions. This preference isn’t accidental. International sanctions and internet restrictions have severed Iranian traders from the real-time financial news feeds, economic calendars, and fundamental data that drive markets in other countries. Price charts, candlestick patterns, and a handful of reliable indicators offer a complete framework that works without external data.
Why Iranian Traders Rely on Technical Analysis

Over 2 million Iranians participate in forex and cryptocurrency trading, with the majority relying on technical analysis tools to make their decisions. This preference isn’t accidental. International sanctions and internet restrictions have severed Iranian traders from the real-time financial news feeds, economic calendars, and fundamental data that drive markets in other countries. When you can’t access Bloomberg terminals, Reuters feeds, or timely central bank announcements, you need a method that works without them.
Sanctions and Market Access Challenges
Banking sanctions mean Iranian traders can’t open accounts with major international brokers that provide premium research, analyst reports, or live economic data streams. VPN connections, while widely used, don’t solve the fundamental problem: many professional-grade news services actively block Iranian IP addresses or require payment methods unavailable to Iranian residents. Even when traders manage to access a platform, the lag in receiving international news can render fundamental analysis nearly useless. By the time a Federal Reserve statement reaches an Iranian trader through unofficial channels, the market has already moved.
The Iranian rial’s volatility compounds these challenges. With depreciation exceeding 600% against the US dollar since 2018, Iranians turned to forex markets not for speculation but for wealth preservation. Technical analysis offered a practical solution: you can identify trends, support levels, and momentum shifts using nothing more than price charts and volume data, both of which are available through most trading platforms that Iranian traders access.
Technical Analysis as a Self-Sufficient Framework
Technical analysis functions as a complete trading system without external inputs. Candlestick patterns, moving averages, RSI, and Fibonacci retracements require only historical price data. A trader in Tehran can study the same EUR/USD chart that a trader in London sees, apply the same indicators, and draw the same trendlines. The method is reproducible, teachable, and independent of news flow.
Most Popular Technical Indicators Among Iranian Traders
Iranian traders gravitate toward a handful of reliable technical indicators, chosen as much for their proven track record as for their minimal data requirements. Moving averages, RSI, and Fibonacci retracements consistently rank as the top three tools, with Bollinger Bands and MACD following close behind. The preference reflects practical constraints: intermittent internet access and the need to make quick decisions on platforms that may disconnect without warning.
Trend Indicators: Moving Averages and MACD
Moving averages form the backbone of most Iranian trading strategies. Simple moving averages (SMA) and exponential moving averages (EMA) help traders identify trend direction without consuming heavy bandwidth. A typical setup pairs the 50-period and 200-period moving averages on the daily chart, with crossovers signaling potential entry points. The Golden Cross (50 EMA crossing above the 200 EMA) and Death Cross (the opposite) remain widely recognized signals among local traders.
MACD complements moving averages by measuring momentum shifts. Iranian day traders watch the histogram for divergences between price action and momentum, particularly on the four-hour and daily timeframes. The indicator loads quickly even on slower connections and provides clear visual signals when the MACD line crosses the signal line.
Momentum and Volatility Tools: RSI and Bollinger Bands
RSI serves as the go-to momentum indicator, with most traders sticking to the standard 14-period setting and the traditional 30/70 or 20/80 thresholds. Overbought and oversold readings help time entries during range-bound conditions, which are common in currency pairs involving the rial. When RSI divergence appears (price makes a new low but RSI doesn’t), traders often prepare for a reversal.
Bollinger Bands answer the volatility question that matters most: is the market about to break out or revert to the mean? Iranian traders use the squeeze (bands contracting) as an advance warning that a significant move is coming. Combined with RSI, the bands help filter false signals during the choppy sessions that often follow Tehran market hours.
Support and resistance levels, drawn manually or using pivot points, underpin all these indicators. Traders mark key levels at the start of each session, then layer on moving averages and oscillators to time precise entries.
Candlestick Patterns and Price Action Strategies
Japanese candlestick formations form the backbone of technical education in Iranian trading communities, with thousands of traders learning these methods through Farsi-language Telegram channels and local webinars. The visual simplicity of candlesticks translates well to mobile screens, which matter when connectivity issues force quick chart reads during unstable VPN sessions.
Why Price Action Works for Iranian Trading Conditions
Price action strategies handle delayed data better than indicator-heavy systems. When a VPN connection stutters or reconnects mid-session, a clean chart showing only candles and support levels stays readable. Oscillators and moving averages recalculate with every data gap, creating false signals. A completed engulfing pattern or pin bar, by contrast, remains valid regardless of a two-minute delay in the feed.
Mobile trading amplifies this advantage. On a phone screen, five indicators clutter the view and slow load times. A single timeframe with marked swing highs and lows gives immediate context. Iranian traders working second jobs or monitoring positions during commutes rely on patterns they can spot in seconds: a doji at resistance, a hammer at support, or three consecutive bearish candles signaling momentum.
Most Commonly Used Candlestick Patterns
Four formations dominate Iranian trading discussions:
- Engulfing patterns signal reversals when a candle fully covers the prior candle’s body, particularly effective at key support or resistance zones.
- Doji candles indicate indecision; traders wait for the next candle to confirm direction before entering.
- Hammer and inverted hammer appear at swing lows, with long lower wicks showing buyers stepping in after sellers pushed price down.
- Shooting star forms at swing highs with a long upper wick, suggesting rejection of higher prices.
Traders combine these with horizontal levels instead of complex indicators. The approach works when chart data arrives in bursts instead of smooth ticks, and when decisions need to happen fast on a 5-inch screen between phone calls.
Multiple Timeframe Analysis Techniques
Iranian traders monitor an average of 3-5 currency pairs simultaneously, switching between charts to confirm setups before entering positions. The method layers information: higher timeframes reveal where price wants to go, lower timeframes show when to act.
Top-Down Analysis Approach
Start with the daily chart to identify the dominant trend. If EUR/USD shows a clear uptrend on the daily with higher highs and higher lows, that’s the directional bias. Drop to the 4-hour chart next to spot pullbacks or consolidation zones within that trend. These become areas where you’ll look for entries. Finally, the 1-hour chart pinpoints precise timing: a candlestick reversal pattern, a break of a minor trendline, or a bounce off a support level that aligns with the larger trend.
This sequence filters noise. A bullish signal on the 1-hour chart means little if the daily timeframe shows strong resistance overhead or a downtrend in control. Confirmation across timeframes reduces false signals because you’re trading with the weight of multiple perspectives.
Timeframe Selection for Day Trading vs. Swing Trading
Day traders working within Tehran market hours typically use these combinations:
- 5-minute and 15-minute charts for scalping trades that last minutes to a few hours, with the 1-hour chart setting the session bias.
- 15-minute, 1-hour, and 4-hour charts for standard day trades held within a single session, closed before sleep to avoid overnight risk.
- 1-hour, 4-hour, and daily charts for swing positions held multiple days, where the daily chart determines trend and the 1-hour chart times entries during Asian or European sessions.
Swing traders lean on daily and 4-hour charts because they’re less affected by intraday volatility and broker spread fluctuations. The broader view also suits traders managing positions part-time around other work.
Trading Platforms and Tools Used by Iranian Traders
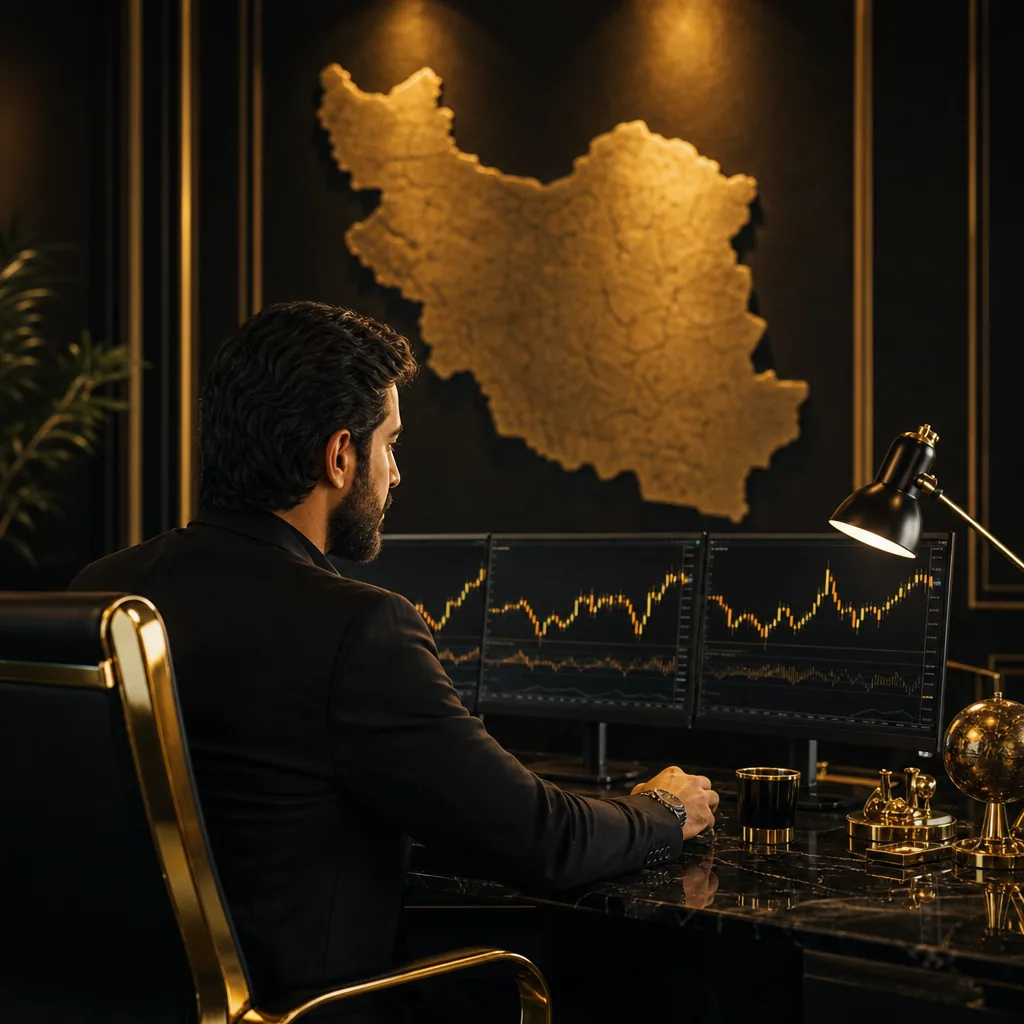
Most Iranian traders rely on VPNs to access international trading platforms, turning connectivity into a daily technical challenge alongside market analysis itself. Sanctions have pushed the community toward offshore brokers that accept cryptocurrency deposits, which means choosing platforms compatible with both decentralized payment rails and restricted internet access.
MetaTrader 4 vs. TradingView for Iranian Traders
MetaTrader 4 remains the workhorse for most Iranian traders because offshore brokers supporting crypto deposits typically offer MT4 integration by default. The platform runs locally after installation, requiring less continuous bandwidth than browser-based alternatives. TradingView has grown in popularity for its superior charting interface and social features, but traders face a split workflow: they analyze on TradingView, then execute on MT4 through their broker’s terminal.
| Platform | Primary Advantage | Main Drawback for Iranian Traders |
|---|---|---|
| MetaTrader 4 | Direct broker integration, works offline after setup | Limited charting tools, outdated interface |
| TradingView | Advanced indicators, multi-timeframe layouts, community scripts | Requires constant browser connection, no direct trade execution with most offshore brokers |
Overcoming Platform Access Challenges
VPN disconnections during volatile market hours create the most frustration. Traders typically keep two or three VPN services active simultaneously, switching providers when one fails. Mobile platforms have become essential backups: many Iranian traders use mobile apps for monitoring positions and placing emergency orders when desktop connections drop.
Cryptocurrency deposit requirements force an extra layer of complexity. Traders convert rial to Tether or Bitcoin through local exchanges, transfer to the offshore broker, then convert again to fund their trading account. This process adds 24 to 48 hours before capital reaches the trading platform, making quick reloads during drawdowns impractical.
Currency Pairs and Markets Iranian Traders Focus On
Iranian traders concentrate their technical analysis on a narrow band of instruments where liquidity generates the clearest chart patterns. EUR/USD and GBP/USD dominate the watch lists, accounting for the majority of retail trades executed from Iran. These pairs move on deep order books that smooth out noise and produce recognizable support levels, trend channels, and candlestick formations that respond predictably to standard indicators.
Why Major Pairs Suit Technical Analysis
High liquidity translates directly into better technical signals. EUR/USD, the world’s most traded currency pair, prints clean price action because millions of participants continuously place orders at every price level. When an Iranian trader spots a double bottom or a moving average crossover on EUR/USD, the pattern reflects genuine market structure. GBP/USD offers similar reliability, with enough volatility to create intraday opportunities while maintaining the liquidity needed for precise entries and exits.
Spread costs matter acutely for traders working with limited capital or facing restrictions on deposit methods. Major pairs carry the tightest spreads on most international brokers, typically 0.5 to 1.5 pips on EUR/USD even for accounts accessed through VPNs. Execution quality stays consistent: stop-losses trigger at intended levels, and slippage remains minimal during normal market hours. These practical factors make major pairs the natural testing ground for technical strategies.
Gold Trading Among Iranian Traders
Gold (XAU/USD) holds a special position in Iranian trading portfolios. Cultural familiarity with gold as a store of value combines with strong technical tradability. XAU/USD respects technical levels with unusual consistency, bouncing off round numbers like $2,000 or retracing to Fibonacci levels with enough regularity that Iranian traders build entire strategies around these patterns. The pair’s liquidity rivals major currencies, and its multi-hour trading session aligns well with Iranian time zones, allowing traders to catch both European and U.S. market moves.
Learning and Community Resources for Technical Analysis
Iranian traders have built an extensive informal education network centered on Telegram, where over 500,000 combined subscribers follow trading education channels focused on technical analysis. These communities serve as the primary learning infrastructure in a market where access to formal trading courses and international platforms remains restricted by sanctions and payment barriers.
Telegram Trading Communities
Telegram has become the de facto classroom for Iranian technical traders. Daily chart setups, candlestick pattern breakdowns, and indicator configurations circulate through dozens of channels, each specializing in different aspects of analysis. Channels post real-time EUR/USD support levels in the morning, share Fibonacci retracement studies on gold by midday, and dissect failed breakout patterns in the evening. The format is collaborative: members screenshot their own MetaTrader charts, annotate resistance zones, and ask for feedback from more experienced traders.
Technical analysis tutorials are the most viewed content type across these channels. A typical tutorial video walks through RSI divergence on a recent GBP/JPY move or demonstrates how to layer Bollinger Bands with moving averages on a 4-hour chart. Comments sections turn into threaded discussions where traders compare their own setups and debate entry timing.
Self-Education and Shared Analysis
This collaborative model compensates for the lack of access to structured courses and certification programs available in other markets. Iranian traders don’t have easy pathways to CMT credentials or university finance programs with trading labs, so they’ve built a peer-to-peer system instead. One trader who masters Elliott Wave counts shares templates; another who specializes in volume profile analysis posts daily breakdowns. The collective knowledge base grows through repetition and shared trial.
The result is a technical analysis culture that’s practical and chart-focused. Traders learn by doing, refining setups based on what worked in yesterday’s session and what other community members flagged as risky.
Practical Tips for Applying Technical Analysis in Iranian Trading Conditions
Trading from Iran introduces friction that can turn a good technical setup into a missed opportunity. VPN latency, payment restrictions, and mobile reliance shift how you apply chart patterns and indicators. These tips keep your technical analysis practical when connectivity and access aren’t guaranteed.
Account for Latency in Order Execution
VPN routing adds 100–300 milliseconds to your connection, sometimes more during peak hours. If you’re trading off a breakout or a precise support bounce, that delay matters. Place limit orders slightly ahead of your technical level instead of market orders at the exact price. For example, if resistance sits at 1.0850 on EUR/USD, set your sell limit at 1.0848. This gives you a buffer when the signal triggers and your order travels through an extra server.
Use Clear Support and Resistance Levels
Horizontal lines and trend lines give you visual anchors that work across any timeframe. Mark major support and resistance zones where price has reversed multiple times, then combine them with ascending or descending trend lines to spot converging setups. This approach doesn’t require heavy calculations, loads fast on mobile charts, and stays readable even if your connection drops mid-session.
Confirm Signals with Multiple Indicators
Single-indicator trades amplify risk when you can’t react instantly to market shifts. Pair momentum tools like RSI with trend indicators such as moving averages. If RSI shows oversold conditions below 30 and price touches a rising 50-period moving average, you have two reasons to consider a long position. Confirmation filters out false signals that cost more when execution speed isn’t on your side.
Stick to Higher Timeframes During Poor Connectivity
Four-hour and daily charts tolerate brief disconnections better than five-minute scalping setups. Swing trades based on daily candlestick patterns give you time to reconnect, adjust stops, and manage positions without split-second decisions. Save intraday trading for sessions when your VPN performs consistently.
Keep Strategies Simple and Mobile-Ready
Complicated multi-indicator systems drain phone batteries and slow chart rendering. Two or three tools (support/resistance, one moving average, one oscillator) cover most setups and run smoothly on MetaTrader or TradingView mobile apps. Simplicity means you can execute trades from anywhere without waiting for a chart to load or an indicator to calculate.
Build Your Technical Framework Around Local Realities
Technical analysis has become essential for Iranian traders because it works without the real-time news feeds and broker research that sanctions block. The combination of moving averages, RSI, Fibonacci retracements, and candlestick patterns forms a complete methodology that runs on price data alone. Multiple timeframe analysis filters noise, and the focus on major pairs like EUR/USD and gold provides the liquidity needed for clean chart patterns.
VPN connectivity and platform access remain daily challenges, but the Iranian trading community has adapted by sharing setups through Telegram, keeping strategies mobile-ready, and choosing higher timeframes when connections falter. The peer-to-peer education network compensates for restricted access to formal courses, creating a practical, chart-focused culture where traders refine methods through shared trial.
Disciplined technical analysis works despite access barriers. Continue testing your setups, document what works in your trading journal, and stay connected to the community channels where experienced traders post their analysis. The constraints you face have shaped a self-sufficient trading approach that doesn’t depend on external data streams or institutional tools.